There are seven main elements to pay attention to in a SaaS Profit & Loss (P&L) statement:
- Revenue
- Cost of Sales (COS)
- Gross margin
- Operating Expenses
- EBITDA
- Other Income and Expenses
- Net profit
Now, you’ll start seeing a lot of abbreviations when you start a conversation around finance. Don’t fret; I promise you they’re not as complicated as they seem.
Let’s start by understanding what are your SaaS operating expenses and what it includes.
Operating expenses (OpEx) refer to expenditures incurred on an ongoing basis. Your OpEx is recorded as costs in your P&L statement because they are related to ongoing business operations to keep your doors open.
The three main areas of your OpEx are:
- Marketing and Sales (M&S)
- General and Administrative (G&A)
- Research and Development (R&D)
Add up the total costs for these three categories, and you’ll have the sum of your operating expenses.
Cost of M&S + Cost of G&A + Cost of R&D = OpEx
You probably know by now: your OpEx is more than just a number. Everything we do in finance is used to evaluate your past performance and make forecasts for the future.
What is your OpEx telling you?
To analyze a software business’s health, you can use the SaaS Rule of 40 as the general rule of thumb. If your growth rate and profit rate adds up to at least 40%, you’re doing alright. If not, then something needs to be done.
The question is: how do you know what to do?
According to Parsa Saljoughian, an investor at IVP, the rule of 40 gives you a high-level insight into your business. But it doesn’t tell you the costs allocated to different areas of your business. This is where your OpEx comes in.
To know which area to optimize, you can combine the rule of 40 with the following recommended benchmarks.
Marketing and Sales (M&S)
Your M&S costs are your most significant driver in income and are included in your Customer Acquisition Costs (CAC) calculation. The M&S cost breakdown takes into account payroll, ad expenses, tools and services needed to run your marketing and sales, etc.
As a benchmark, the average spend for this area is approximately 48% of your revenue. It means that your M&S costs account for 48% of your revenue. For example, if you’re generating $200,000 in revenue per year, your M&S costs would be around $96,000.
While this is the average benchmark for most SaaS companies, it’s also essential to understand your expenditures’ efficiency. If this cost is efficient in driving growth, it will make sense to invest more in this area. For example, invest in growing the sales team or a customer self-onboarding system.
If you’re burning more money faster than you can generate revenue, then you either need to re-evaluate your marketing and sales efforts or your product. Let’s say you’re generating $200,000 in revenue per year, but your M&S costs are around $120,000 (60% of revenue). What does that tell you? It could mean:
- Your ads aren’t driving conversion.
- Your product doesn’t have the right market fit.
- You need to consider downsizing your team.
However, it doesn’t mean you’re not doing well just because your M&S costs are around 60% of your revenue. For example, it could mean that you are charging annual deals, investing in growth, and growing fast.
If this happens, your Customer Lifetime Value (LTV) and Customer Acquisition Costs (CAC) are more critical factors to consider if you’re spending your money efficiently.
The metrics to look for are:
- LTV to CAC ratio - The ideal ratio for a growing SaaS business is 3:1.
- CAC payback time - Aim for a CAC payback time of less than 12 months to increase your revenue growth.
Before you start slashing costs in this area, bear in mind that it is common for early-stage startups to have slightly higher than average spend in this area.
General and Administrative (G&A)
G&A expenses are also known as your overhead costs. It includes everything you need to run your day-to-day operations. For example, rent, utilities, travel, internet bills, legal, human resources payroll, and other costs that don’t fit into M&S or R&D.
As a benchmark, the average spend for this area is approximately 20% of your revenue. The costs allocated here should improve your company’s productivity and efficiency daily. It involves all expenses incurred in the day-to-day operations of your business.
Typically, this is the target area for cost-cutting when a business runs into cashflow problems. Let’s say you have a cash runway of 12 months, and you’re trying to stretch it to 18 months. Raising funds doesn’t seem like a viable option at the moment. You’re confident you can double the revenue, but you just need more time. What are your options?
- You could move to a smaller office space to reduce rent and utilities.
- Reduce headcount in departments that are not driving results.
- Cancel subscriptions to services that don’t improve productivity and efficiency.
When evaluating your G&A expenditures, ensure that it is directly related to the results you are trying to achieve.
Research and Development (R&D)
Any costs incurred in product development fall under your R&D category. Like M&S, this includes payroll, software and tools needed to run your research and development, etc.
As a benchmark, the average spend for this area is approximately 23% of your revenue. However, this number varies vastly depending on the stage of your SaaS business.
R&D refers to any kind of activities companies undertake to innovate and develop new products. Suppose you’re an early-stage startup in a highly competitive market. In that case, it is only natural that you dedicate more extensive resources to this area to drive growth and capture/maintain market share.
Let’s say you’re currently generating $1,200,000 in annual revenue, but you have a revenue growth of 120%. You know that there is a demand for your product. A company of this size would typically invest approximately 40% of its revenue in R&D to develop its product further and grow its customer base.
A company generating $25,000,000 in annual revenue with a growth rate of 50% might invest approximately 25% of its revenue in R&D to retain customers.
Key takeaway:
The three main areas of your operating expenses (OpEx) are Marketing and Sales (M&S), General and Administrative (G&A), and Research and Development (R&D). These areas directly impact your revenue growth.
Use the SaaS rule of 40 to evaluate the general health of your software business. However, your OpEx helps you decide which area to optimize to increase your profitability.
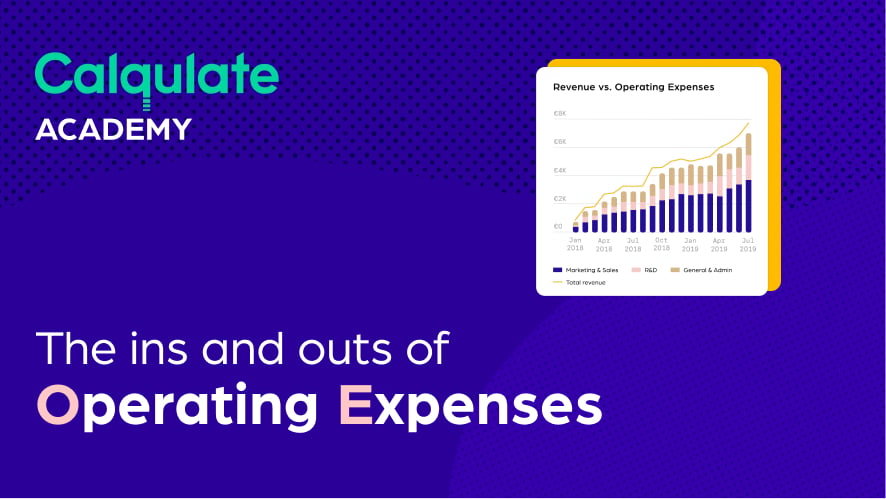
It is important to see the evolution of OpEx over time, for example, how much Marketing and Sales expenses are of total revenue over time. Visualizing the OpEx in a line chart usually does the trick.
Note: The above benchmarks are not set in stone. They’re guidelines to work with.
Happy Calqulating!