Your bookkeeper is in charge of making sure your expenses are mapped correctly. It is then up to your CFO to map out the correlation between your Profit & Loss, profitability analysis, and Chart of Accounts. But what happens if you don’t have a CFO yet?
Our copywriter, Serena, came up to me the other day to ask me a couple of questions about the Chart of Accounts. So I did a quick demo on Calqulate to show her how to map expenses and how they appear in the charts.
“That’s it? So how do I explain it to someone who doesn’t know Chart of Accounts? It doesn’t seem very significant,” she said.
Truth be told, apart from the bookkeeper, no one cares about the Chart of Accounts. Serena isn’t the only one who thinks mapping the Chart of Accounts just seems like a task with no purpose. It’s a technical accounting term that means almost nothing to a founder, for example.
But here’s where it gets interesting:
Your Chart of Accounts is more than just mapping your expenses correctly and knowing how much you have in your company’s account. It also contains metrics that can tell you a lot about your company’s financial performance.
Don’t worry, you won’t have to sit through an entire degree program in finance just to understand your metrics. All you need to know is the fundamental metrics of a SaaS business and how they relate to each other in your financial analytics, and you’re good to go.
So let’s start here.
What is a Chart of Accounts?
A Chart of Accounts (CoA) is a financial tool that provides a complete listing of every account, including the subcategories, of a company. It’s used to organize finances and give stakeholders a clearer overview of your company’s financial health.
For example, within the accounts of an income statement, your expenses can be broken into operating expenses, marketing and sales expenses, cost of sales, depreciation expenses, staff costs, etc.
Structuring and mapping your CoA accurately from the get-go will help you tremendously in your Profit & Loss (P&L) forecasting. The CoA can be utilized as a powerful mapping tool and foundation for further financial analysis.
Why bother with your Chart of Accounts?
The great thing about data and numbers is that they don’t lie if (big IF) you do them right. While mapping your Chart of Accounts may not seem like a significant thing to do, you definitely should give it some attention.
Your metrics are there to help you navigate through the business. If you’re not achieving your milestones or don’t know when to invest in scaling your business, know that you can ALWAYS rely on your metrics for those purposes.
Let’s say you scaled too soon and realized that you’d shortened your cash runway by 20%. What do you do then? Some of the possible options are:
- Reduce operating expenses (OpEx)
- Increase your cashflow with upfront payments
- Expand your Net Revenue Retention (NRR)
If you’re wondering how I came up with these possible solutions, the answer is pretty simple. As a CFO, it’s easy for me to draw the correlation between the numbers and direct our KPIs accordingly. Once again, what happens if you don’t have a CFO yet and you’re running a company with limited financial knowledge?
You’re not alone. Most startups don’t hire a CFO until much later. You may think: But I have an auditor who pulls data from my accounting software. Wouldn’t they be able to tell me more?
There are 2 things to take into consideration here:
- Most accounting software don’t have the capability to map your CoA for expense analytics and profitability analysis. At most, it’ll generate a standard P&L statement in a format that is suitable for the tax office and auditors. But you will not have insights into your gross margin rate, EBITDA, and expense analytics. You’ll need a separate software to do that.
- Your accountant is, more than likely, not interested in your SaaS P&L metrics. Their task is to make sure your accounts and reporting are done correctly. What you do with the metrics is entirely up to you – that’s the job of a CFO. The people who are interested in your P&L metrics though? Your management team and investors.
That said, mapping your CoA from the get-go will provide you with the insights of a CFO even if you don’t have a finance background. More importantly, you’ll be able to:
-
- Direct your KPIs accordingly towards growth; and
- Communicate better with your stakeholders. In this lesson, we’ve covered that preparation is key to a highly effective communication with your investors.
- Direct your KPIs accordingly towards growth; and
Here’s how to use your Chart of Accounts to gain insights into your:
Gross margin rate
Gross margin is the amount left after deducting the Cost of Sales (COS) from the total revenue. The COS for SaaS businesses typically includes the following cost centers:
- Wages of Support staff
- Services
- Wages of Customer Success staff
- DevOps
- Payment processing expenses
- Hosting expenses
Create specific accounts in your Chart of Accounts for the above-mentioned expenses to accurately calculate your COS and Gross Margin. Once you have your COS and gross margin, you can use your gross margin rate to help you figure out how to grow your revenue faster than your COS.
For example, if your staff cost is higher than what you’d initially budgeted for, it will have an impact on your gross margin. From here, you can either:
- Increase revenue by acquiring more customers; or
- Make internal adjustments such as reshuffling your resource allocation; or
- Invest in self-serve onboarding, so you don’t have to increase headcount.
EBITDA
EBITDA stands for Earnings Before Interest, Tax, Depreciation, and Amortization. It’s a metric that measures a company’s overall financial performance. Essentially, it’s a valuation tool investors use to gauge your company’s profitability before further investment.
It provides an idea of your company’s ability to generate cashflows and takes into account operational expenses ONLY that are necessary to keep your business running.
Create specific accounts in your CoA to map out your:
- Tangible assets such as equipment, computers, vehicles, etc;
- Intangible assets such as trademarks and copyrights;
- Interest expenses such as borrowed funds or any kind of debts;
- Taxes – any kind of payable tax liabilities.
Investors often use EBITDA as a metric to determine the price they’re willing to invest in a company. It’s because your EBITDA margin indicates growth potential. The higher the margin, the better.
It gives your stakeholders an idea of how much operating cash is generated in relation to the total revenue earned and use it as a benchmark to decide the most financially efficient investment.
Expense analytics
Any kind of expenditure is recorded as costs in your P&L statement because they are related to ongoing business operations to keep your doors open. Let’s take your Operating Expenses (OpEx) as an example.
The three main areas of your OpEx are:
- Marketing and Sales (M&S)
- General and Administrative (G&A)
- Research and Development (R&D)
These areas directly impact your revenue growth. Add up the total costs for these three categories, and you’ll have the sum of your operating expenses.
Group the expense accounts in your Chart of Accounts under the above-mentioned three groups and you can track the evolution of the expenses.
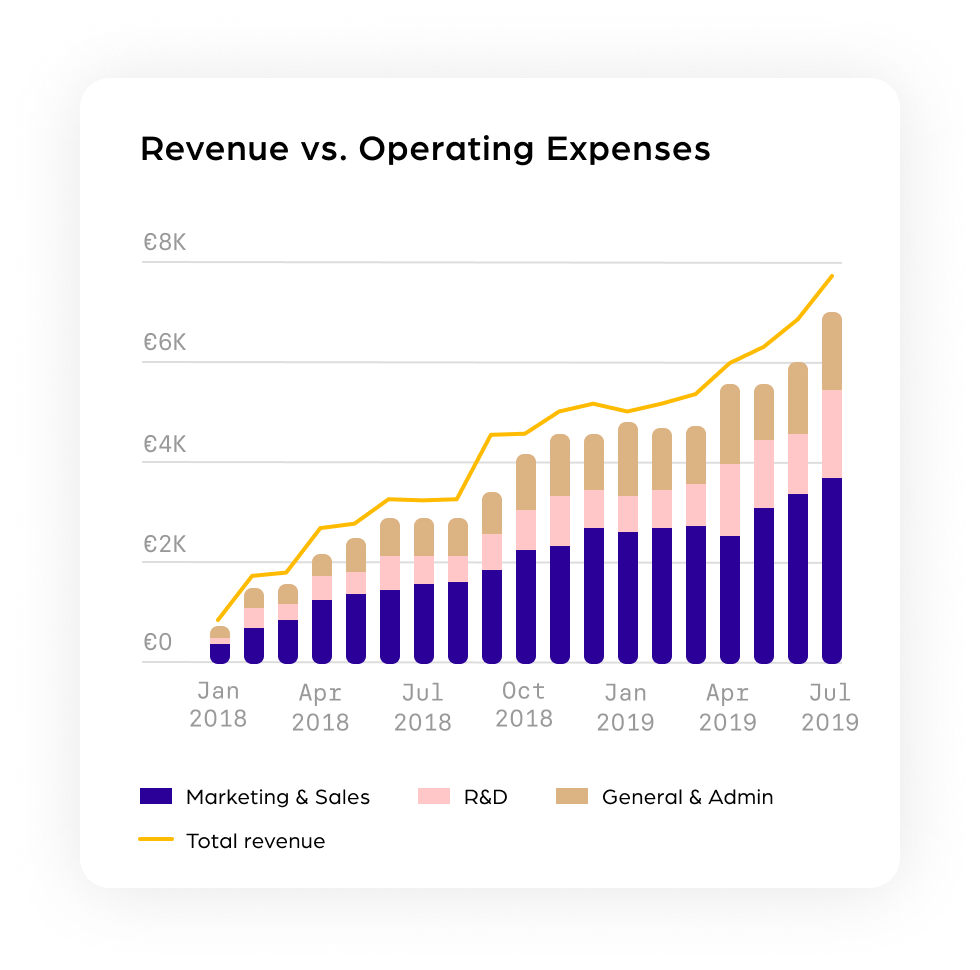 For example, it will enable you to compare how much your total Marketing and Sales expenses are from your revenue over time. As a benchmark, the average spend for this area is approximately 48% of your revenue. It means that your M&S costs account for 48% of your revenue.
Let’s say you’re generating $200,000 in revenue per year, your M&S costs would be around $96,000. If you’re burning more money faster than you can generate revenue, then you either need to re-evaluate your marketing and sales efforts or your product.
But it doesn’t always mean you’re not doing well because growth takes time. You’ll then need to consider your Customer Lifetime Value (LTV) to Customer Acquisition Costs (CAC) ratio and CAC payback time to figure out if you’re spending your money efficiently. Observe the evolution of your expenses to identify patterns, opportunities, and threats.
CFO Tip:
Most companies instinctively opt to shrink their teams when they run into financial challenges. But that may not always be the best option. It’s the fastest short-term solution, but it’s not always the best solution.
By observing the evolution of your metrics, you’ll be able to identify the best possible option for the situation. The more details you know about your cashflow and growth metrics, the more you’re able to utilize your financial analytics to achieve the outcome and growth you envision for your company.
My advice: start by mapping your CoA.
Key takeaway:
I probably (maybe even definitely) sound like a broken record by now – it’s not enough to look at a single metric on its own, and you shouldn’t.
Any metric that is looked at in isolation becomes a vanity metric. Any metric that is paired with another complementary metric turns that pair into a Key Performance Indicator (KPI) that is actionable and insightful.
For example, measuring your CAC alone doesn’t tell you anything more than the amount you spend on acquiring a customer. You’ll have to pair it with other metrics such as LTV, CAC payback time and Monthly Recurring Revenue (MRR) growth for a clearer picture.
The purpose of mapping your CoA is so that you’ll get the detailed full structure of your P&L elements such as Cost of Sales (COS), gross margin rate, EBITDA, and all expense groups.
Trust me, it’ll make your profitability analysis, KPI calculation, and Profit & Loss forecasting so much easier once you have all that in place. In turn, you can use your financial analytics to strategize accordingly and direct your KPIs in the right direction. It’s all about growth and profitability.
Happy Calqulating!