
It started with a casual question to my team: What would you call the combination of two metrics?
I was half-expecting the answer to be something along the lines of ‘actionable metric’. But the team was getting creative, so we kept rolling with more suggestions.
“What else?” I continued asking them – this is a great question to keep ideas flowing.
Our product designer, Yi-Ning, suggested we call the combination of two metrics Chopsticks Metric.
“It’s like chopsticks. They always come in a pair!” he said.
He’s right. And that’s how we settled on the name.
Chopsticks metrics: how to make your metrics actionable?
To make your metrics actionable and insightful, you ALWAYS need to combine one metric with another. Otherwise, it becomes a vanity metric – nice to look at, makes you feel good, but drives no results.
In this lesson, we’ve covered a list of the actionable metrics you should be tracking:
- Monthly Recurring Revenue (MRR)
- Net Revenue Retention (NRR)
- Customer Acquisition Costs (CAC)
- Customer Lifetime Value (LTV)
- LTV:CAC
- CAC payback time
- Churn
- Gross margin
- Cost of Sales (COS)
- EBITDA
- Net profit
- Operational Expenses (OpEx)
- Average Revenue Per Account (ARPA)
When you pair some of these metrics together, you’ll get insights into different areas of your business. For example:
Chopsticks metric #1:
| Metric | When you pair it with... | You get insights on your |
| CAC | LTV | LTV:CAC ratio The ideal ratio is 3:1 |
| ARPA | CAC payback time The ideal payback time is less than 12 months. |
|
| Revenue | Sales and marketing operational performance | |
| NRR | Company's profitability |
When you look at your CAC as a standalone metric, it gives you an idea of how much it costs you to acquire a customer. But it doesn’t tell you anything else.
It doesn’t tell you if your sales and marketing is performing well or whether you’re ready to scale. How would you know then?
One of the riskiest things to do when running a business is to make wild guesses – our gut feeling isn’t always right, especially when we’re under pressure (or hungry).
This is where pairing your metrics helps tremendously. For example, when you pair CAC with LTV, you’ll get insights into your LTV:CAC ratio. This ratio is going to determine whether or not you’re ready to invest in growth. Here’s why:
The ideal ratio to aim for is minimum 3:1.
It means that your customer is bringing in three times the amount of revenue than what it costs to acquire them. If it costs $1 to acquire a customer, ideally, they should be bringing in at least $3 in revenue.
If your LTV:CAC ratio is:
- Below 1:1—either you’ve just launched a company, or you’re on a sinking ship.
- 1:1—for every new customer, you are losing the same amount of money.
- 3:1—This is your minimum target to build a scalable and efficient growth engine. Usually, CAC is paid upfront, and the customer pays during the long lifetime.
- Above 3:1—Fantastic. Make sure you invest heavily in customer acquisition and be ahead of the game. It’s time to burn some cash, baby!
This is just one example to consider. There are many other ways to pair your metrics as your company continues to scale. The following examples are the basic pairings you will need for your business.
Chopsticks metric #2:
| Metric | When you pair it with... | You get insights on your |
| Churn | MRR + Expansion Revenue + Downgrades | NRR |
| Customer lifetime + Average purchase frequency | Customer segmentation analysis | |
| ARPA + Gross margin % | LTV |
Chopsticks metric #3:
| Metric | When you pair it with... | You get insights on your |
| ARPA | Purchase frequency + Customer lifetime | LTV |
| Churn | 1. Revenue forecasting 2. Financial health |
|
| CAC payback time | 1.Pricing strategy 2.Marketing and sales expenses 3.Product validation |
|
| LTV and/or NRR | Customer segmentation |
Chopsticks metric #4:
| Metric | When you pair it with... | You get insights on your |
| Net profit | MRR | Company's overall health (Growth-profit rate) |
Chopsticks metric #5:
| Metric | When you pair it with... | You get insights on your |
| OpEx | Revenue |
Operational performance for: |
These are some of the possible ways to create your Chopsticks metrics and the insights they provide you.
You should always look at the evolution and growth of these metrics to make them truly actionable. That means looking at your metrics on a weekly on monthly growth evolution and not at accumulative numbers.
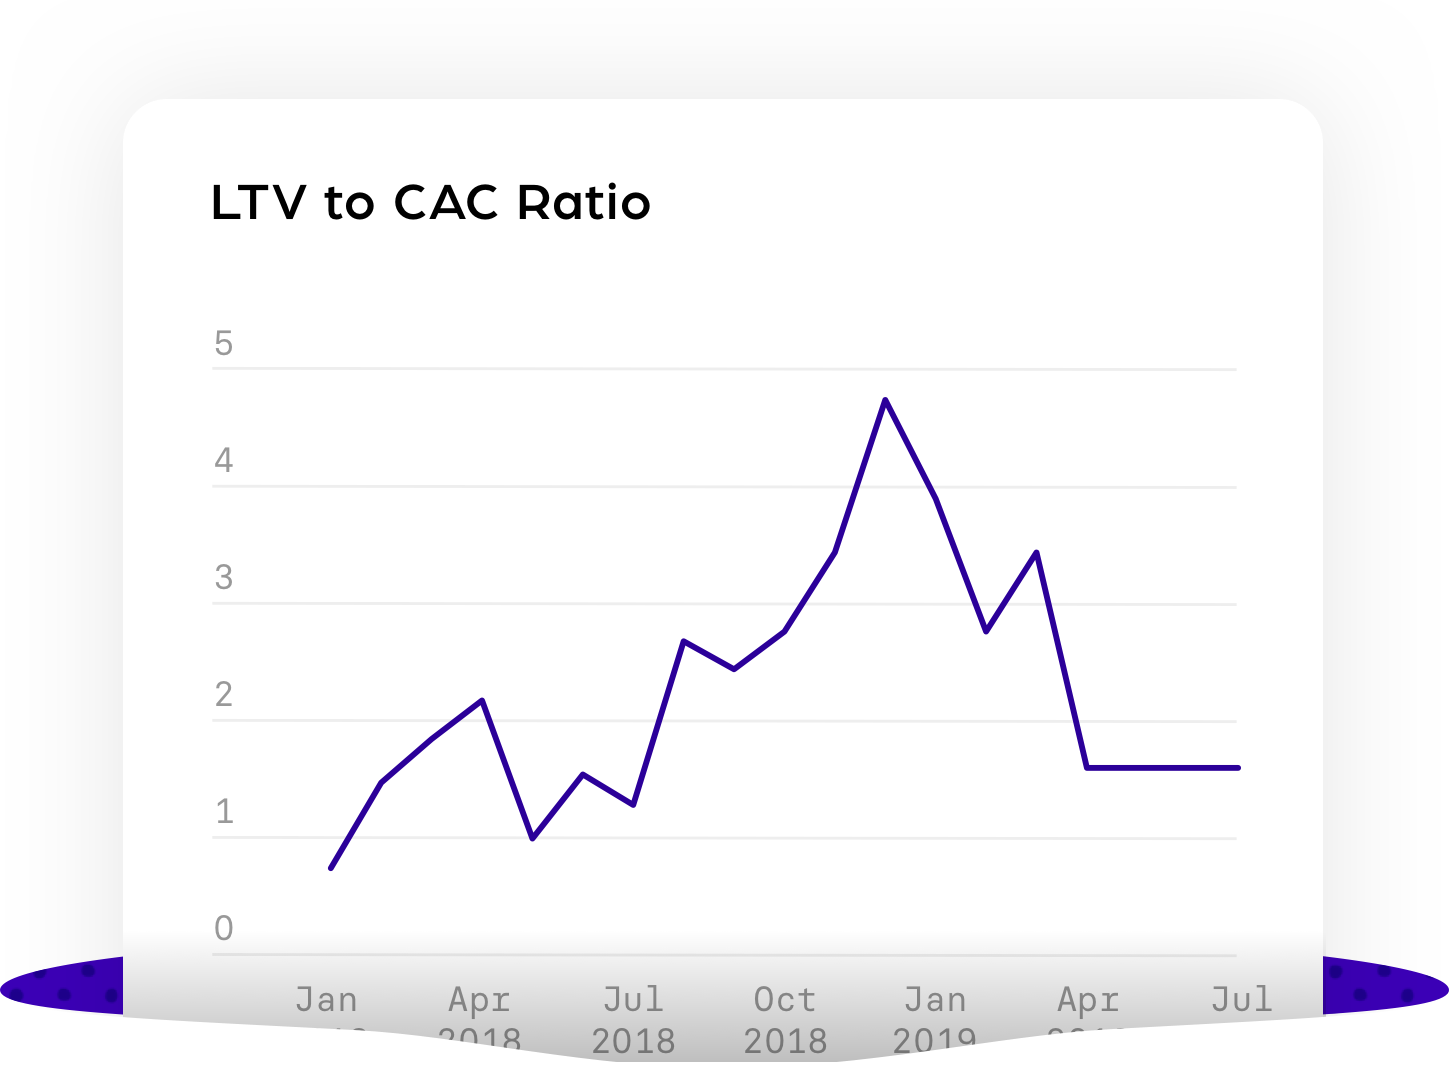
For example, instead of looking at your LTV:CAC ratio as it is every month, visualize them in a line chart to analyze the evolution of your LTV:CAC ratio. As such:
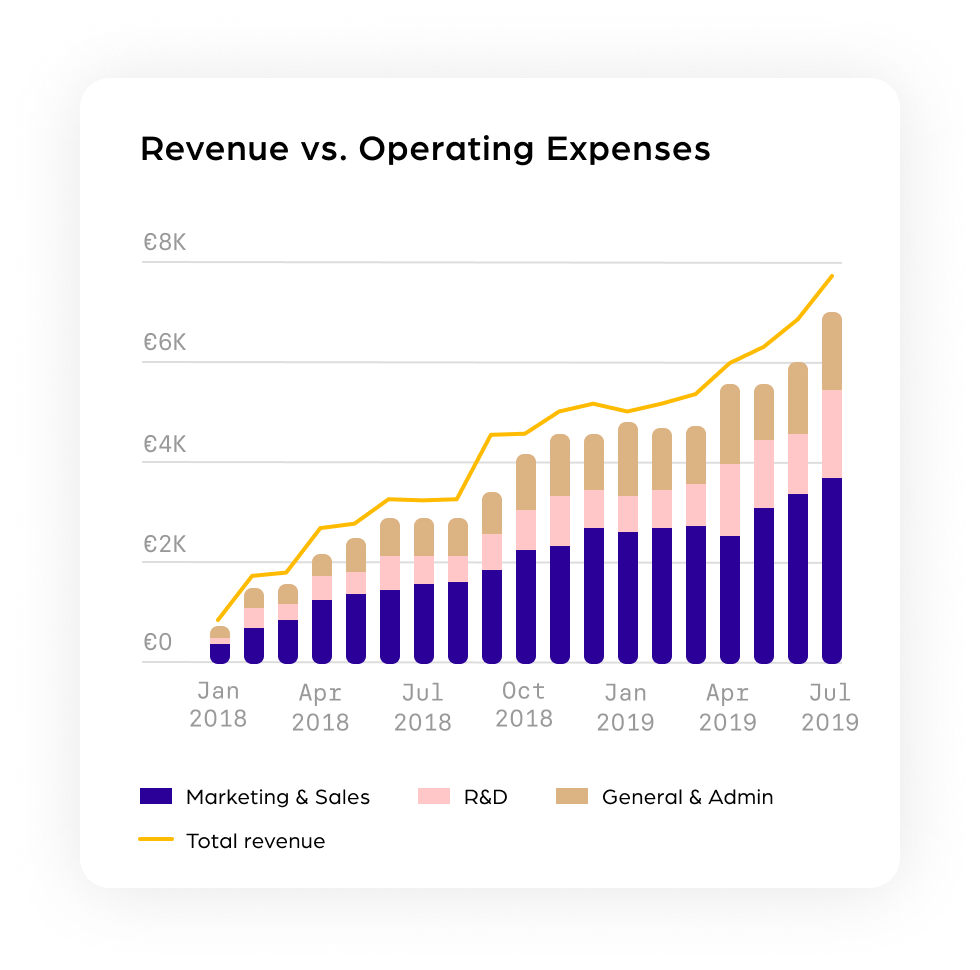
Let’s say you’re analyzing your OpEx, and would like to know if your monthly Marketing and Sales expenses are justified. Then, you could view it like this:
 Key takeaway:
It’s completely normal that your metrics become more complex as your company grows. That said, there will also be many more ways to combine each metric to turn them into actionable metrics.
The bottom line, never look at any metrics in isolation. There are, however, very few exceptions to this rule. Your Monthly Recurring Revenue (MRR) and Net Revenue Retention (NRR) are the only metrics you can look at in isolation. These metrics play an immense role throughout the lifetime of your business because they directly measure the lifeline and expansion of your business.
Otherwise, always remember your Chopsticks Metrics.
Bon Appetit and Happy Calqulating!